Using the Spotify API for data-driven analysis of my playlists (Part 1/2)
Have you ever wanted to analyse the music in your Spotify playlists? Well, I know I did for a few months and I finally bit the bullet.
These APIs provided by media services are not just an excellent exercise to practice Data Science skills, but also to get something valuable for our day to day lives. In my specific case, I wanted to identify duplicate tracks — not just complete duplicates, but also duplicates across e.g. album and single releases — and analyse audio features such as acousticness, danceability, energy, and more.
What you will learn
This will be a two-part series for me to explain the end to end process of extracting data from Spotify, processing it, and finally visualising it with Power BI. Part one will detail how to extract all the data from Spotify via its API with Python, process the data, and store it as Parquet files. Part two will detail some key aspects of the dashboards produced with Power BI, namely the underlying data model, and tricky visualisations and measures.
Prerequisites
For this data extraction part, you need two things: a Spotify application, Python and the relevant libraries installed.
For the Spotify application, despite the name, this is a “bot” that you create by accessing your Spotify dashboard on the web. This dashboard is used to manage this application/bots so you can connect to the API in a programmatic fashion. Please refer to this previous article I wrote for details on the process.
Creating a Spotify application will generate a client ID and a client secret which are analogous to a username and password to identify your application by. These credentials are used to authenticate into the API and obtain an access token. This access token must be included in all further API calls in place of credentials.
In the Python realm, you need two libraries: requests to interact with the API, and pandas for data processing. Unlike my previous article, this time we’ll handle the API requests ourselves, instead of letting the Spotipy library handle it.
Relevant API Endpoints
There are four endpoints relevant to this project:
- Authorization with client credentials: authorize your application in the API and receive a valid access token for further requests
- Get users’ playlists: get a list of public playlists displayed on the user’s profile
- Get playlist items: get tracks, artists, and albums available in a playlist
- Get tracks’ audio features: get audio features for multiple tracks, such as acousticness, danceability, and more
I highly recommend checking the reference documentation yourself for further details and the console for testing the endpoints.
Please note playlists must be public and added to the user profile. For example if I pull the data for my profile, it will only show the playlists that meet these criteria, not all of them.
Furthermore, keep in mind a track’s audio features might take some time to be made available by Spotify, i.e., avoid pulling audio features for songs that have just released.
With this information in hand, it is time to turn the attention to Python.
Authentication
Assuming you have created the Spotify application, authentication and getting an access token is achieved with a single request.

This is effectively a form of basic authentication, i.e., authentication with a username and password pair, so the request should be handled as a Session object from requests.
The credentials are passed to the auth property of the object and finally perform the POST request, saving the result in the auth variable. This can be converted to JSON format, accessing the access token via the access_token field.
In other words, the function authenticates the Spotify application via an API request and returns the access token string.
This token will be used going forward as the form of authentication.
Pull user playlists
The user playlists’ endpoint is used to pull a list of playlists names and respective IDs available for a particular user. As mentioned before, these playlists must be public and added to the user’s profile, otherwise the API won’t have access to them. This is because the application, or more specifically the client credentials authentication, only has access to public data — at least without further work outside the scope of this article.
This is another straightforward API call, but the JSON response requires a small transformation to be usable.
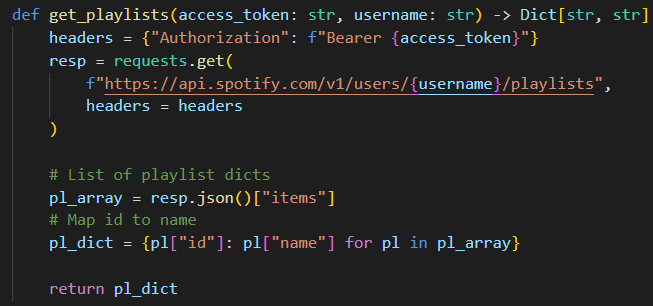
Note how the access token is passed in the headers of the request as part of what is called a Bearer token authentication.
resp.json() will be a common pattern to parse the returned data as JSON across these API requests. In this case we then take the data inside the items field, and process it in a dictionary comprehension to map each playlist id to its name.
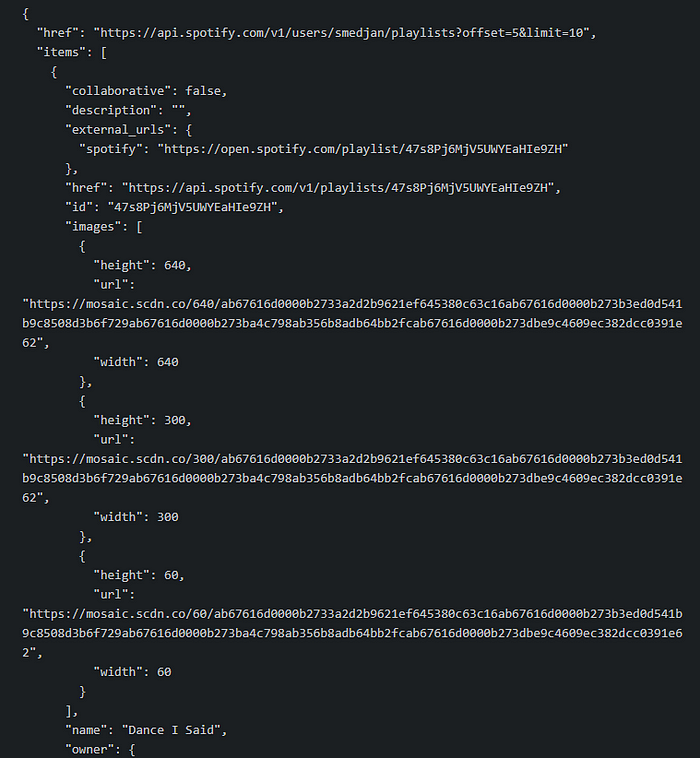
Below you see a sample response from the Spotify API console. That items field you see at the beginning is the one we read inside the function, and since that is an array, the dict comprehension loops through each element inside the array to map the id to the playslist name (right at the bottom of the screenshot).
The dictionary output by the function looks like this:

This is a handy format for the follow up requests and data transformations.
Pull playlists contents
Next step is to pull playlist contents. The playlist items endpoint includes not just the tracks, but also information about the respective albums and tracks. This is a lot of JSON to process and data to model into a tabular format, so I separated the code into two functions: one to handle the API calls and another to process each JSON response.
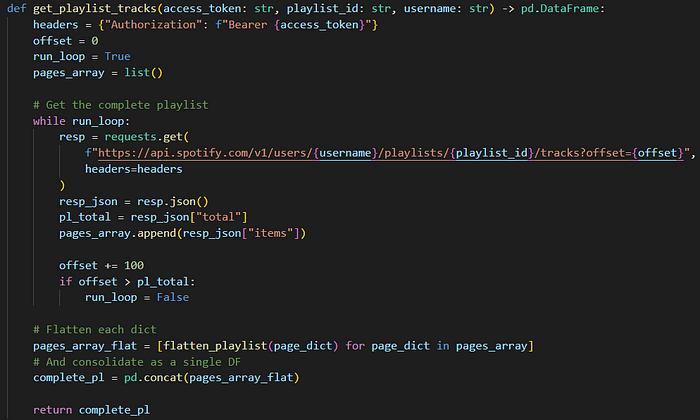
This is a paginated endpoint, i.e., it requires multiple requests to get all the available tracks. From personal tests, I found it optimal to request 100 tracks at a time: the first request pulls the first 100 tracks, the second pulls the following 100 tracks and so on.
The function above uses a while loop to call the API while there are still more tracks to pull, using an offset variable to keep track of how many tracks have already been pulled. Each request checks for the number of tracks available to calculate if the loop should be stopped.
After all the requests have been completed, then I use a second custom function to flatten each individual JSON response into a proper DF. This is saved in that pages_array_flat list and afterwards I generate a pandas DataFrame (DF) that combines all the individual DFs.
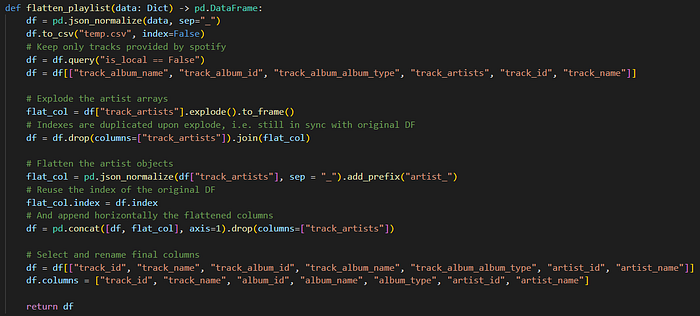
Most of the flattening is handled by the pandas built-in function json_normalize, I only do some final touches to get the data into my desired format.
The result from the two custom functions above is a DF with the columns track_id, track_name, album_id, album_name, album_type, artist_id, artist_name.
If the two functions are used to get all the track information for a single playlist, then we can add a third function to the mix that repeats this logic for all the playlists pulled before.
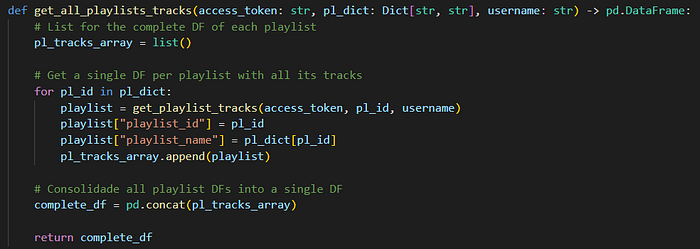
This way we can generate a single DF with all the tracks, albums and artists data for a single playlist, but also combine it across multiple playlists into a single DF. Note how I handle this logic in a loop and always add the playlist id and name to the individual playlist DF. This way I know to which playlist the data belongs to, something very important for the Power BI report.
At this point, this DF stands on its own and can be exported as Parquet, ready to be read by Power BI.

index = False ensures the numeric DF index is not included in the exported file.
Pull tracks’ audio features
With all the playlist data processed, we can focus on audio features. Spotify uses an internal machine learning algorithm to generate audio features for tracks, such as acousticness, energy, loudness and more. I really recommend checking the documentation for descriptions of these measures.
We can take the distinct track ids we already have and pull the audio features for each one. The only thing to keep in mind is that audio features are not calculated immediately after tracks’ release, so you may find missing data if your favourite artist has just published a new song.
Again, this data includes a complicated JSON response, so I wrote two custom functions, one to handle the requests, another to process JSON.
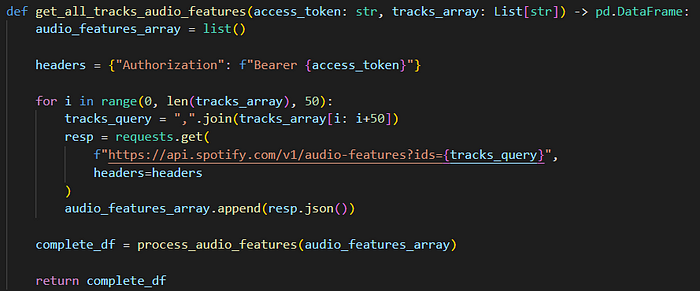
This endpoint can accept up to 50 tracks at once, so it’s essentially 50 requests for the price of 1. The format accepted for this query is a list of comma-separated track ids, which the function stores in the tracks_query variable each iteration.
The process_audio_features function processes all the JSON and returns a single DF.
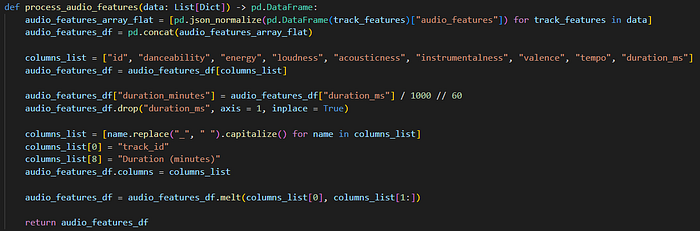
The endpoint has many audio features, but I only kept danceability, energy, loudness, acousticness, instrumentalness, valence, tempo and duration in miliseconds.
Aside from JSON flattening, I also convert the duration to minutes (only, without seconds), and clean up the audio features’ names to remove the underscores. This could be done in Power Query but saves me the hassle to do it here.
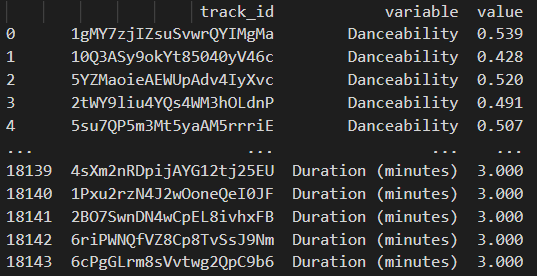
The resulting DF is unpivoted to have one column for the track id, one for the audio feature, and another for the actual value. In other words, each track has eight rows, one row per audio feature.
Closing thoughts
And we’ve reached the end of Part 1. As a summary we’ve covered:
- REST requests in Python
- Client credentials authentication with the Spotify API
- Pulling user playlists
- Pulling playlist contents
- Pulling track audio features
- Processing JSON data with Pandas and generating Parquet files to store the resulting DFs
We are ready to move on to Part 2 and build or, technically, showcase a Power BI report that analyses this data. For my specific use case, I analysed
- Audio features across playlists, artists, and albums
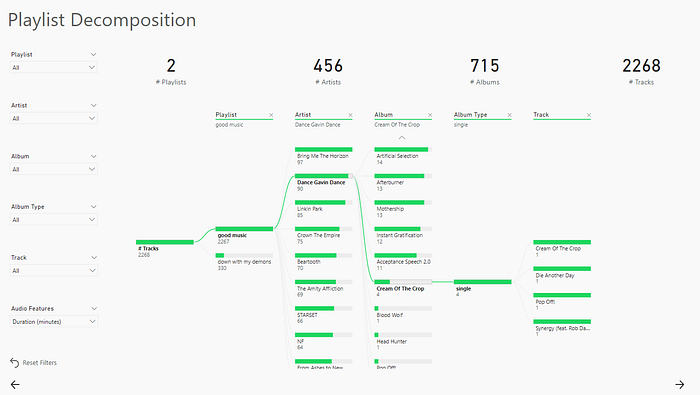
- A page to visually explore the contents of playlists using the decomposition tree visual
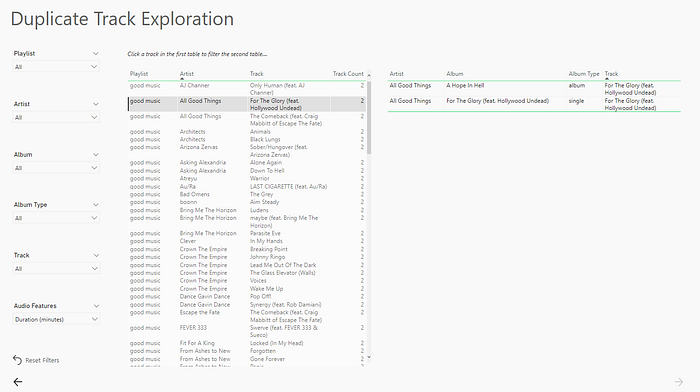
- Duplicate tracks in playlists
I’ll leave a few screenshots of the report down below.
Lastly, you can find a complete script for the code shown above on my GitHub repository here.